


Office Sales Volume, Prices Surge
The tech and life sciences sectors are the main drivers of office investment and development, according to the latest Yardi Matrix report.
Report Highlights
- Transaction volume reached just under $57 billion through the year’s first eight months
- The average full-service equivalent listing rate was $38.70 per square foot in August, a 10-basis-point decrease from the same period last year.
- Office vacancy continued its downward trajectory, averaging 14.8 percent across the top 50 U.S. office markets.
- The under-construction pipeline included 139.9 million square feet of office space at the end of August.
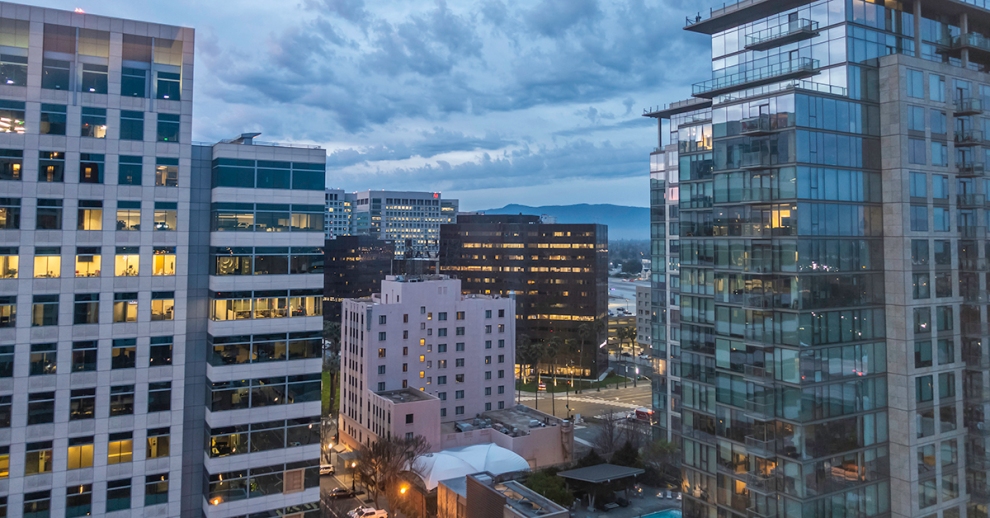
Office transaction volume totaled $56.9 billion at the end of August, with office assets trading at an average of $258 per square foot. Investment activity year-to-date in August was highest in Dallas ($3.5 billion), Boston ($3.3 billion), Manhattan ($3.3 billion) and Washington, D.C. ($3.2 billion). Meanwhile, office buildings commanded the highest sale price per square foot in markets filled with trophy buildings, such as Manhattan ($901 per square foot) and San Francisco ($881).
Some 139.9 million square feet of office space was under construction across the nation at the end of August, representing 2.2 percent of total stock. Going forward, Yardi Matrix will report differently on new office development, and reports will account for the amount of rentable office space within a property. With this in mind, 128 million square feet of rentable space was under construction as of August, with the bulk concentrated in tech-centric and life science hubs such as Manhattan (19.5 million), Boston (12.5 million) and Austin (8.8 million).
New supply drives up listing rates
National average full-service equivalent listing rates clocked in at $38.70 per square foot in August, decreasing by 10 basis points from the same period last year. The largest gains year-over-year in August were recorded in markets benefitting from a large active pipeline, such as Boston (17.7 percent year-over-year increase), Charlotte (16.2 percent increase) and San Diego (11.8 percent increase).
The new stock which is being added to these markets’ office inventory has been driving up average rates, reflecting the product listed rather than changes in market fundamentals. Meanwhile, listing rates continued to be elevated in gateway markets such as Manhattan ($81.22 per square foot), San Francisco ($66.52 per square foot) and the Bay Area ($53.74 per square foot). Meanwhile, office vacancy nationwide stood at 14.8 percent in August, down 30 basis points compared to July and 10 basis points from the same period last year.


Add Comment